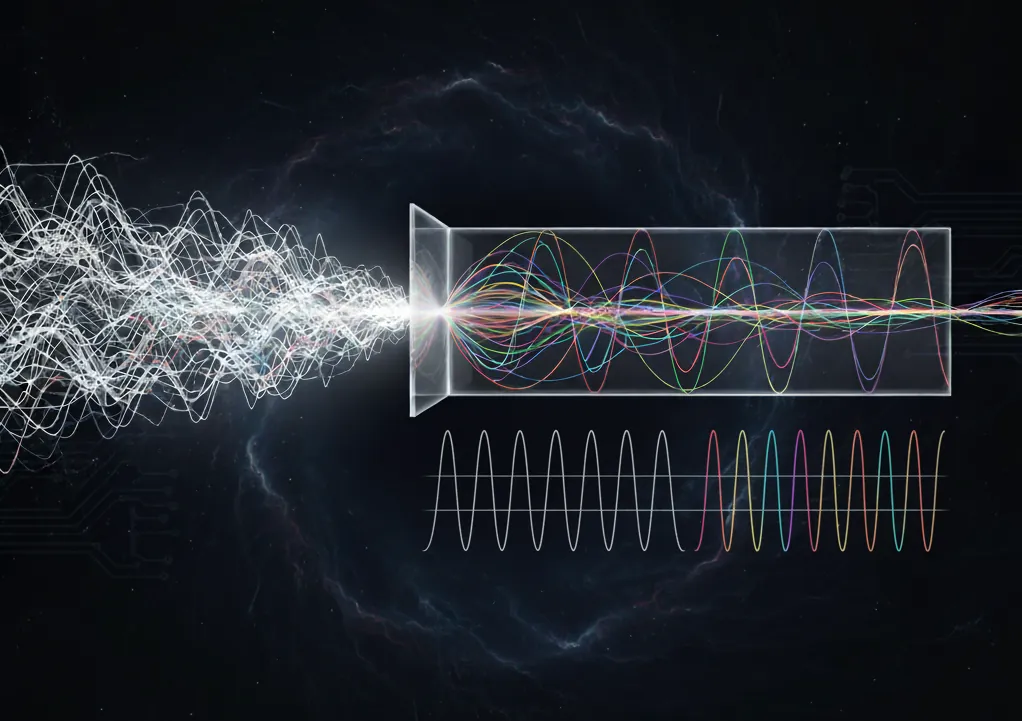
A Prism for Signals
Just as a prism separates white light into colors, Fourier analysis deconstructs a noisy signal into its component parts.
Explore the Noise
Simulate signals. Adjust their frequency, their intensity (strength), and the overall noise level.
- Frequency cues, not identity. You won't see per-signal colours in either chart—the Fourier transform shows what frequencies exist, but not which original source they came from.
- Peaks guide the search. Clear peaks can still be spotted, illustrating how you might tune into a signal you are looking for despite the noise.
Each preset illustrates how signals emerge—or disappear—depending on their strength and the noise floor.
Signal 1
Signal 2
Show me the data!
While excellent at telling us that a signal exists and at what frequency, Fourier analysis tells us nothing about the signal's meaning or content. It provides the "what" (the frequency and strength) but not the "why" or the "so what." The following analogies help explain this crucial limitation.
📡 Identifying a Radio Station
Fourier analysis can identify a strong signal at 98.7 MHz, telling you that a radio station is broadcasting. However, it cannot tell you if that station is playing classical music, a news report, or a talk show. To understand the content, you need a radio receiver to demodulate the signal and a brain to interpret the sounds.
📖 Reading a Foreign Book
Imagine analyzing a book in a language you don't understand. A frequency analysis might reveal that the letter 'e' appears most often. This is a correct fact about the text's structure, but it tells you nothing about the story, characters, or author's intent. Meaning requires a layer of interpretation that the analysis alone doesn't provide.
The Interpretation Gap
Meaning hides in how a signal is modulated, not just in how loud a spike appears.
A Fourier spectrum confirms that something is transmitting energy at specific frequencies. What it cannot do is decode the intent of that transmission. To reach the message, you must understand which property of the carrier wave was varied to carry meaning.
Amplitude (Intensity)
In AM, the message rides on changes in intensity. Sidebands around the carrier frequency contain the actual information, not the static height of the carrier spike itself.
Frequency (Position)
In FM, meaning appears as controlled deviations around a center frequency. The carrier peak reveals a channel exists, but the motion of that peak over time is where the payload lives.
Phase (Alignment)
In PM, information is written into shifts of the waveform's starting angle. Phase relationships determine symmetry and feature placement that magnitudes alone cannot expose.
Encoding Information: Magnitude vs. Phase
- Amplitude (Intensity): Vary the strength of the carrier to imprint the message (AM).
- Frequency (Position): Vary the carrier's instantaneous frequency to carry content (FM).
- Phase (Shift): Vary the waveform's alignment to encode data (PM).
The information may reside in the magnitude, the frequency shift, or the phase shift. Fourier analysis reveals where energy is concentrated, but by itself it cannot interpret how that energy was modulated into meaning.